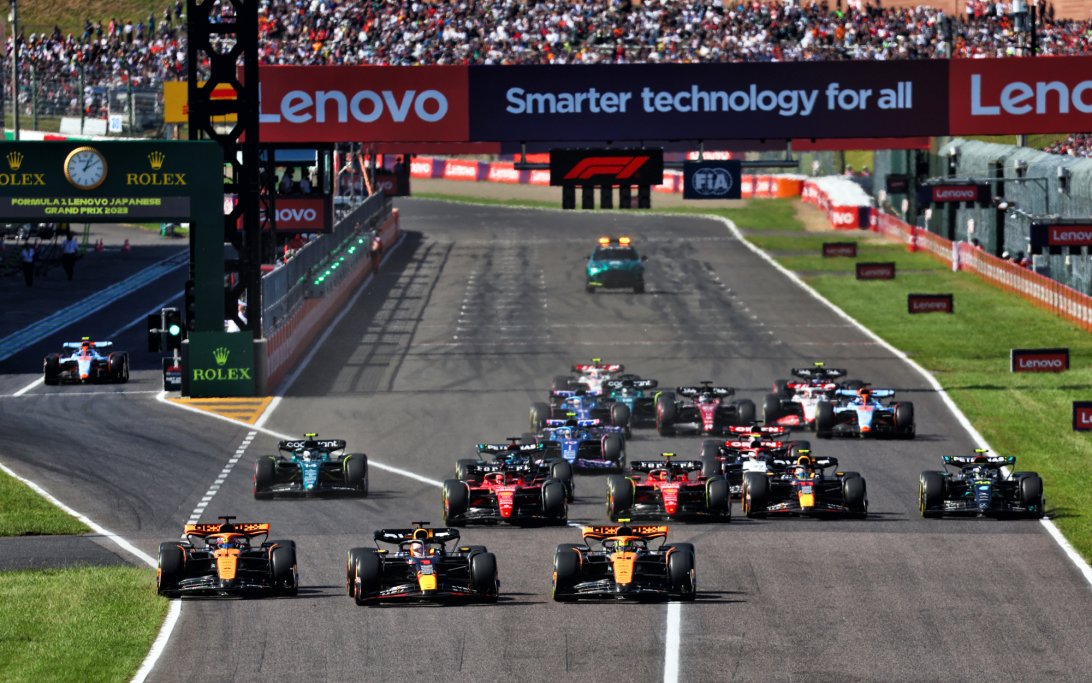
Red Bull concluded a dominant Formula 1 campaign in Abu Dhabi that saw it round off the season with 860 points - the most for a constructor in F1 history.
Its massive tally comes despite the spending restrictions that have been in place since 2021. For three seasons, teams have been operating under a budget cap that aims to equalise the field and eliminate the prospect of huge spending differentials throughout the grid.
The cap was originally set at $175,000,000 but the figure was reduced to $145m for its debut year in 2021 in response to the COVID-19 pandemic. It has been reduced further ever since with this year's cap standing at $135,000,000.
With the limitations in place, even the grid's most recent newcomer Haas has had the tools available to spend right up to the cap limit despite finishing last in the Constructors' Championship twice in the last three years.
While the cap is officially listed at $135m, the true figure is higher when taking into account indexation as a result of inflation and the cost of living that has impacted economies worldwide.
Additionally, under the sport's financial regulations, in the event that a campaign has more than 21 races, the figure is raised by $1.8m for every race beyond that number.
This past season was scheduled to have 24 Grand Prix weekends but that became 23 when China's event was cancelled for the third consecutive year due to COVID-19.
Imola's race was also abandoned at the last minute due to devastating floods in the area but the FIA still counted it as an event due to the late nature of the cancellation and the efforts the teams made to set up operations at the track.
Taking into account these allowances and others including the in-season test sessions that teams carry out alongside tyre supplier Pirelli, a ballpark figure of $150m can be applied.
With all 10 teams presumed to be running at the cap, Red Bull has been left as the most cost-effective team on the grid with each point coming in at just short of $175,000.
Mercedes and Ferrari were less than half as efficient as Red Bull last year amid their tussle for second place in the standings, such was the gap that the reigning World Champions held over its rivals.
McLaren's tally could have looked much more dreary if not for its recovery in the second half of the season as it rose from back-of-the-grid competition to consistent podium contention.
Haas, who finished at the bottom of the standings with 12 points, had the worst spend-to-point ratio in the field with each point rounding out to roughly $12.5m.
Take a look at the full figures below.
| # | Team | 2023 Points | Cost per point ($) | Cost per point (£) |
|---|---|---|---|---|
| 1 | Red Bull | 860 | 174,418 | 137,453 |
| 2 | Mercedes | 409 | 366,748 | 289,023 |
| 3 | Ferrari | 406 | 369,458 | 291,158 |
| 4 | McLaren | 302 | 496,688 | 391,424 |
| 5 | Aston Martin | 280 | 535,714 | 422,180 |
| 6 | Alpine | 120 | 1,250,000 | 985,087 |
| 7 | Williams | 28 | 5,357,142 | 4,221,802 |
| 8 | AlphaTauri | 25 | 6,000,000 | 4,728,420 |
| 9 | Alfa Romeo | 16 | 9,375,000 | 7,388,156 |
| 10 | Haas | 12 | 12,500,000 | 9,850,875 |
Don't miss out on any of the Formula 1 action thanks to this handy 2026 F1 calendar that can be easily loaded into your smartphone or PC.
Download the calenderMost read
In this article





Join the conversation!